
How Much Bitcoin Should You Own? Is Bitcoin Nearing a Cycle Low?
If you've been watching Bitcoin's price swings and wondering whether now is the time to buy, you're not alone. Bitcoin moves in long, 4-year cycles and has fallen 70–85% in bear markets. That reality makes it unsuitable for many people's short-term goals. At the same time, for investors who can stomach extreme volatility and have a long horizon, Bitcoin can be a useful part of a diversified portfolio.
The RiskRadar | BTC Risk Metric: a practical guide to Bitcoin risk
This post explains how I use The RiskRadar's BTC Risk Metric to think about timing, position sizing, and practical next steps. My goal is to keep this non-technical: no heavy math (which was necessary to create the metric).
Note: this is not investment advice. Do your own research and consider your personal financial situation before making any decisions.
What is The RiskRadar BTC Risk Metric?
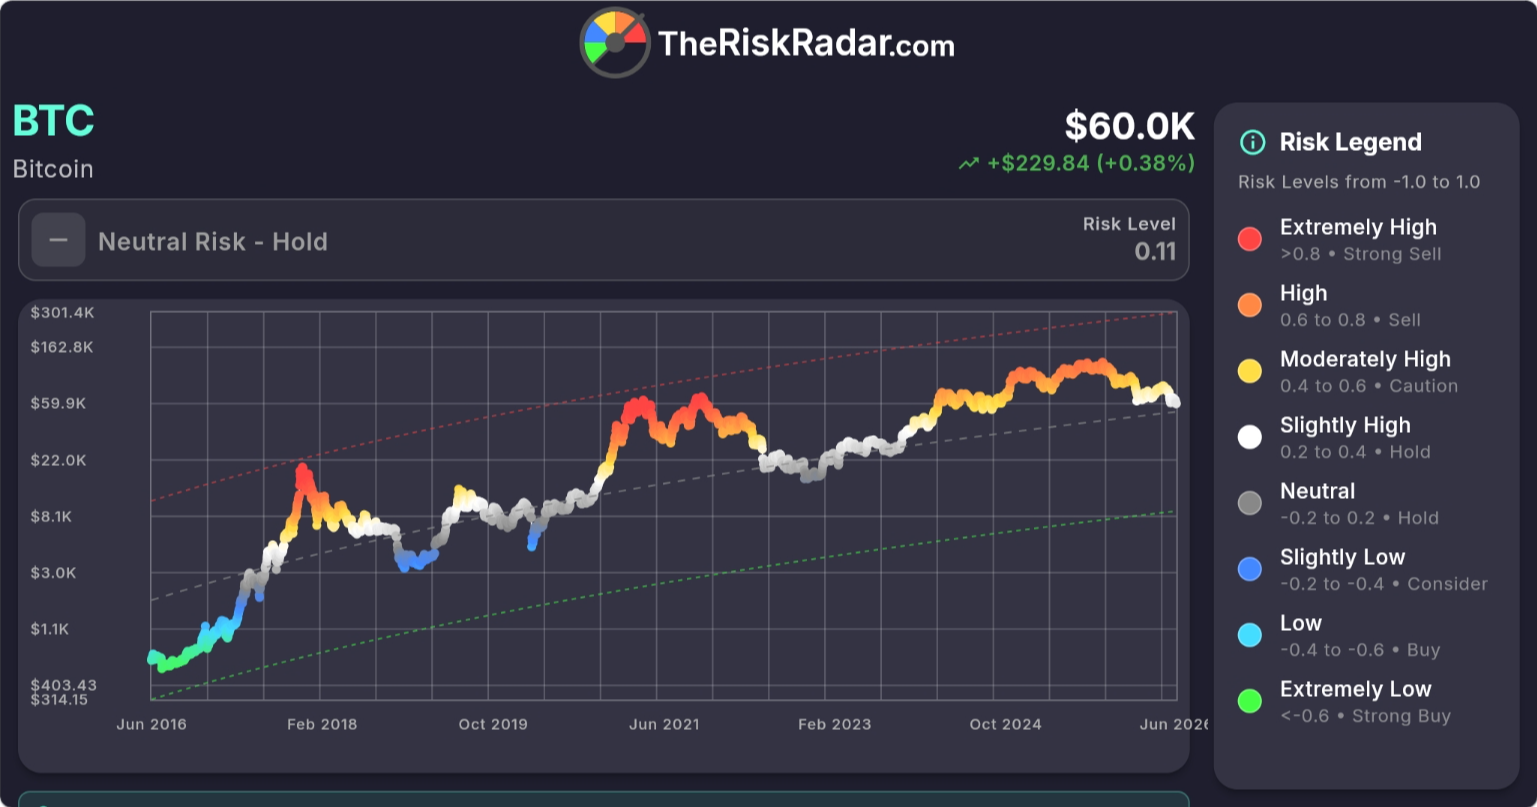
The RiskRadar, https://theriskradar.com, is a color-coded, easy-to-read chart that compares Bitcoin's price to a long-term trend (as seen in the cover image). The metric maps price deviations from that trend onto a simple scale from -1.0 to +1.0. The bands are based on prediction intervals around the trend: when price sits below the trend the score is negative ("cheap"), and when price is above the trend it is positive ("expensive").
Think of it like a weather forecast for price: green/blue = relatively calm/low risk, orange/red = high-risk/overpriced. The tool is designed to answer the practical question: "compared to the long-term trend, is Bitcoin cheap or expensive right now?"
At the time I drafted this post - June 26th, 2026 - The RiskRadar was showing +0.11, one of its lowest readings in almost 3 years (since October 22nd, 2023). Readings change - use the live chart at https://theriskradar.com for the current risk value.
How I interpret the bands (practical, not academic)
These bands are derived from statistics/prediction intervals: they express how far price is from the trend in units of uncertainty (standard error). You don't necessarily need to understand the exact formula (a regression to the mean) to utilize the output to inform your decisions - treat it as one relative gauge you should use alongside others that help you scale buying and selling behavior.
- Green / "extremely low": historically rare price territory - we haven't seen numbers in this range since 2017 and may never again.
- Blue / "low": historically depressed time periods - last time we saw risk in blue was during the 2020 COVID pandemic and we might need another "black swan" event to see them again. Historically great times to buy.
- White-Grey / "neutral": prices near or around the trend, a "fair-value," so to speak. Anything grey or below has historically been a statistically reasonable time to buy during past cycles.
- Yellow / "moderately high": prices above the trend. No cause for concern, but exercise caution. Prices above this might be times to start to consider dollar-cost averaging out of Bitcoin, not in huge amounts but comparable to the risk.
- Orange-Red / "high-extremely high": price is well above trend - increased probability of a bear market and lower prices in the future. These have usually been pretty good times to sell in larger quantities with numbers above +0.8 being historical market cycle tops.
Practical rules of thumb (how to act)
- If you cannot tolerate a 70–85% drawdown (or would panic-sell if your position fell that far), avoid holding Bitcoin.
- If you can tolerate deep drawdowns and have a horizon of 4+ years, consider a small allocation: 1–3% of a portfolio is relatively conservative, 3–6% is a high exposure, and 6–10% is an aggressive allocation for skilled crypto investors who understand the risks. These are opinions, not recommendations. Treat holding Bitcoin like a single stock. If you wouldn't put that much money into a single stock (like the SpaceX IPO), don't put that much into Bitcoin either. Bitcoin is not a get-rich-quick scheme.
- Use The RiskRadar as one input among several: on-chain indicators (Glassnode/CoinMetrics), valuation measures (MVRV Z-score, Pi Cycle Top), and macro context. No single metric should make or break a decision.
A simple DCA scaling approach
If you prefer dollar-cost averaging (DCA), consider scaling your contributions based on The RiskRadar risk value. Example (illustrative only):
- Risk low / -0.2 or below (green/blue): increase DCA purchase amounts (e.g., 2x or more) while staying within your risk tolerance. Consider accumulating up to 2% or more of your portfolio during these historical low times (we may never see them again).
- Risk neutral / -0.2 - +0.2 (grey): continue your normal DCA purchase schedule. These have been historical lows the past two cycles.
- Risk slightly high / +0.2 - +0.6 (white/Yellow): hold and wait, pause your DCA purchases.
- Risk high +0.6 or higher (orange/red): consider buying and holding for the long-term, but if you want to divest (maybe your BTC percent allocation is getting too high for your risk tolerance) consider starting to DCA out of Bitcoin. When it gets to +0.8 (red) or higher increase your DCA sale position size (2x or more) or think about reducing your allocation significantly as these have marked historical tops.
Some people use stepped DCA (increase buys as risk drops further). That can work, but it requires discipline - you must be emotionally prepared to continue for long periods. If you already have the money, consider lump-sum investing where time in the market usually beats out holding some funds so you can DCA later (see Vanguard's study on lump sum investing beats dollar-cost averaging 68% of the time) and you would have less purchases/sales to track for tax documentation.
ETF vs. self-custody
Many readers are better off using a low-cost Bitcoin ETF (or a regulated custodian) rather than self-custody. The mantra "not your keys, not your crypto" is technically true, but self-custody introduces real operational risk: lost seed phrases, mis-sent transactions, and theft. For most people, a low-fee ETF like FBTC or IBIT is a sensible starting point. Avoid high-fee products (e.g., legacy GBTC-like fee structures).
What I check alongside The RiskRadar
- On-chain supply metrics and flows (Glassnode, CoinMetrics)
- Valuation indicators like MVRV Z-score and realized/unrealized P&L (researchers and on-chain analytics)
- Macro liquidity and risk appetite (watch for volume spikes on TradingView)
- Historical drawdowns (watch for greater than 70% - though we might not hit it considering the last market cycle highs were not as euphoric and thus volatility and the lows may not be as extreme)
- https://colintalkscrypto.com/cbbi/ shows a number of different metrics compiled in one location at the bottom of their page
- https://alphasquared.io/risk-based-dca/
I also follow measured, research-driven commentators for their videos, such as:
- Ben Cowen (Into the Cryptoverse)
- Jordan Lindsey (Conquer Trading & Investing)
Quick takeaway
- If you can't tolerate large losses or need the money soon: don't own Bitcoin.
- If you have a long horizon and can tolerate volatility: consider a small, diversified allocation and use The RiskRadar as a timing/size signal - not a crystal ball.
Thank you for checking out our other website: https://theriskradar.com
Disclosure: not financial advice. I run The RiskRadar - this post explains how I use the tool; it's meant to inform, not to direct your investments.